Portfolio schedule intelligence for infrastructure PMOs — in the tool your team already uses
Purpose-built for energy, utility, and data center PMOs. DCMA 14-point schedule health grading, critical path analysis, resource optimization, and baseline variance tracking — all within Power BI.
Built for Infrastructure
Your organization likely already has Power BI through Microsoft 365. BFVZ brings infrastructure-specific intelligence to the analytics tool your team already has access to.
- Hyperscale construction with 7-year interconnection queues
- Speed-to-power is the #1 site selection driver
- Multi-utility coordination across electrical, water, cooling, and telecom
- Substation and switchgear milestone tracking
Hyperscale Construction
Campus-scale builds, power delivery, cooling
Colocation Facilities
Multi-tenant builds, Equinix & Digital Realty class
Edge & Modular
Prefab deployments, retrofit scheduling
- Joint venture scheduling across multiple utility providers
- Cross-utility dependency chains with typed relationships
- Regulatory milestone tracking for permits and inspections
- DCMA schedule health for utility undergrounding programs
Energy & Power
Generation, transmission, distribution
Water Infrastructure
Treatment, conveyance, cooling systems
Renewables & Storage
Solar, wind, battery storage programs
- Transmission and distribution pipeline scheduling
- LNG terminal construction program management
- Resource conflict detection across shared craft labor
- Baseline variance tracking for pipeline corridor projects
Oil & Gas Transmission
Long-haul pipelines, compressor stations
Water Conveyance
Aqueducts, pump stations, treatment plants
LNG Facilities
Export terminals, liquefaction plants
- Fiber deployment and 5G rollout scheduling
- Tower infrastructure construction management
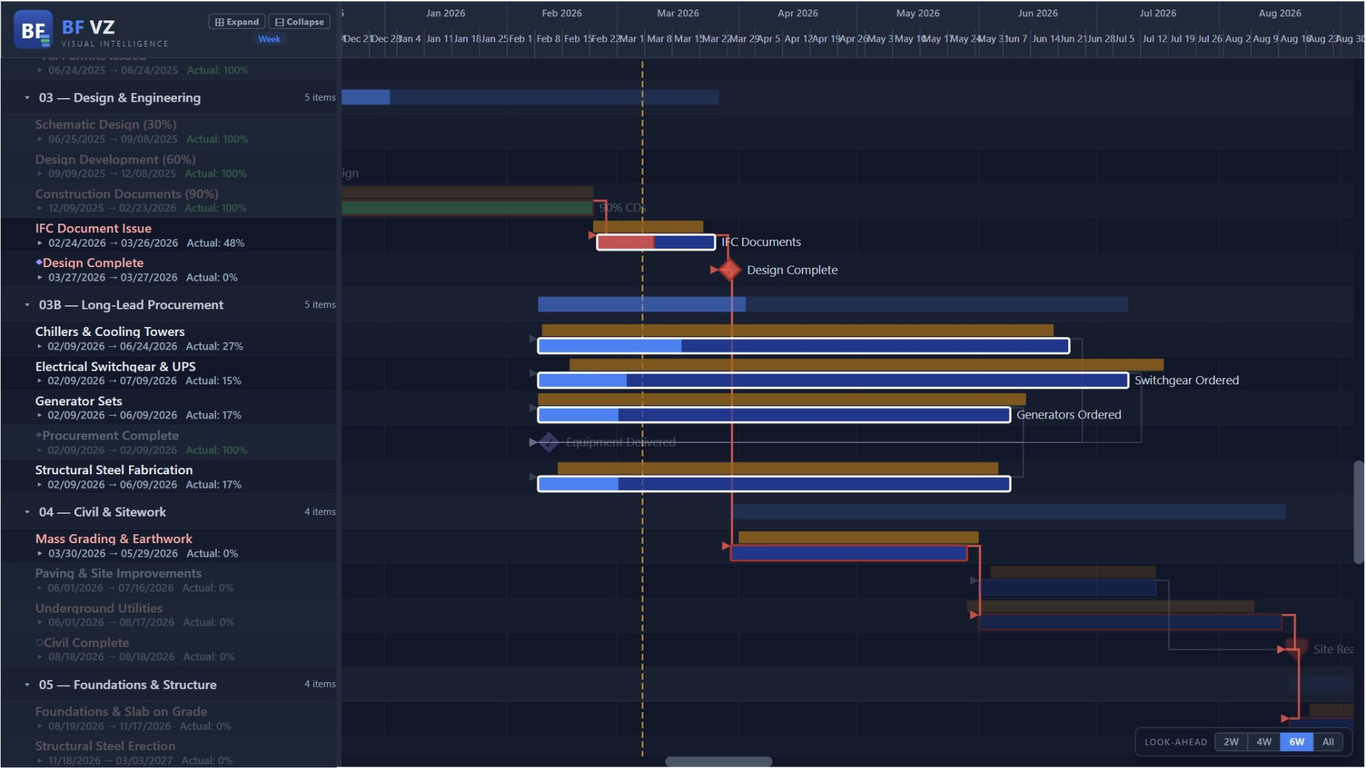
- Look-ahead filtering for near-term crew dispatch
- Cross-project resource balancing for field crews
Fiber Networks
FTTH rollouts, backbone infrastructure
Tower Infrastructure
5G deployments, tower construction
Small Cell & DAS
Urban densification, in-building wireless
Purpose-built capabilities for infrastructure PMOs
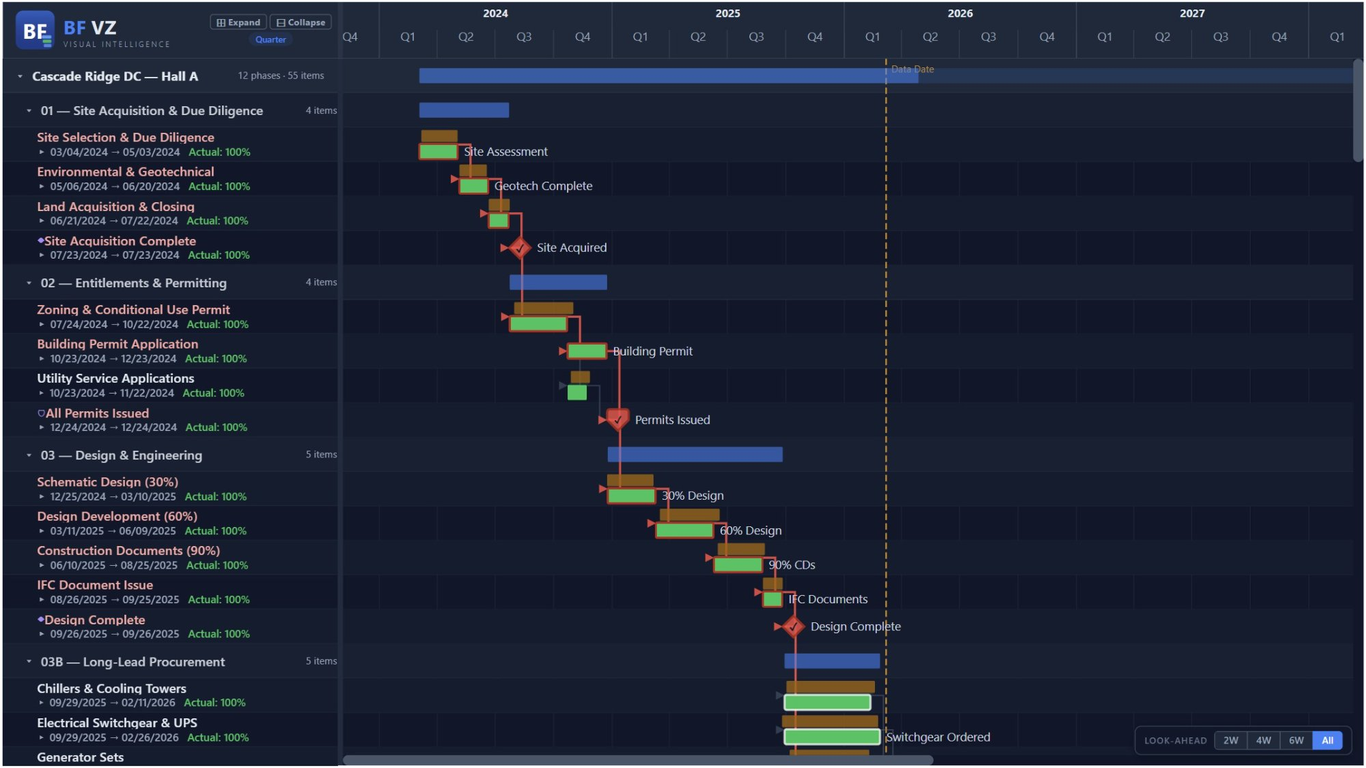
Interactive Gantt Preview
Interact with a live Gantt chart showing critical path analysis on sample infrastructure data.
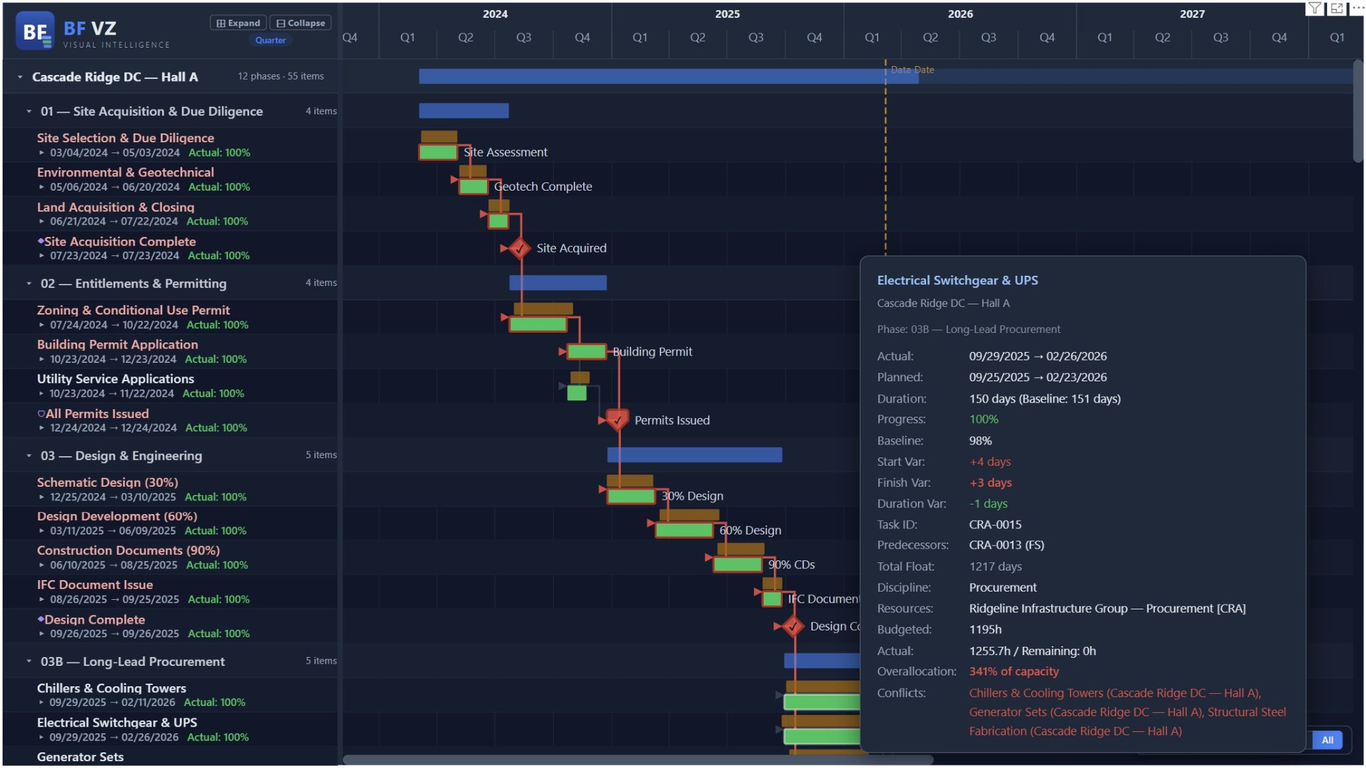
Critical Path Analysis
Full CPM engine with forward/backward pass calculating ES, EF, LS, LF, and total float for every task. Project-level critical path in red. Near-critical path highlighting with configurable float threshold.
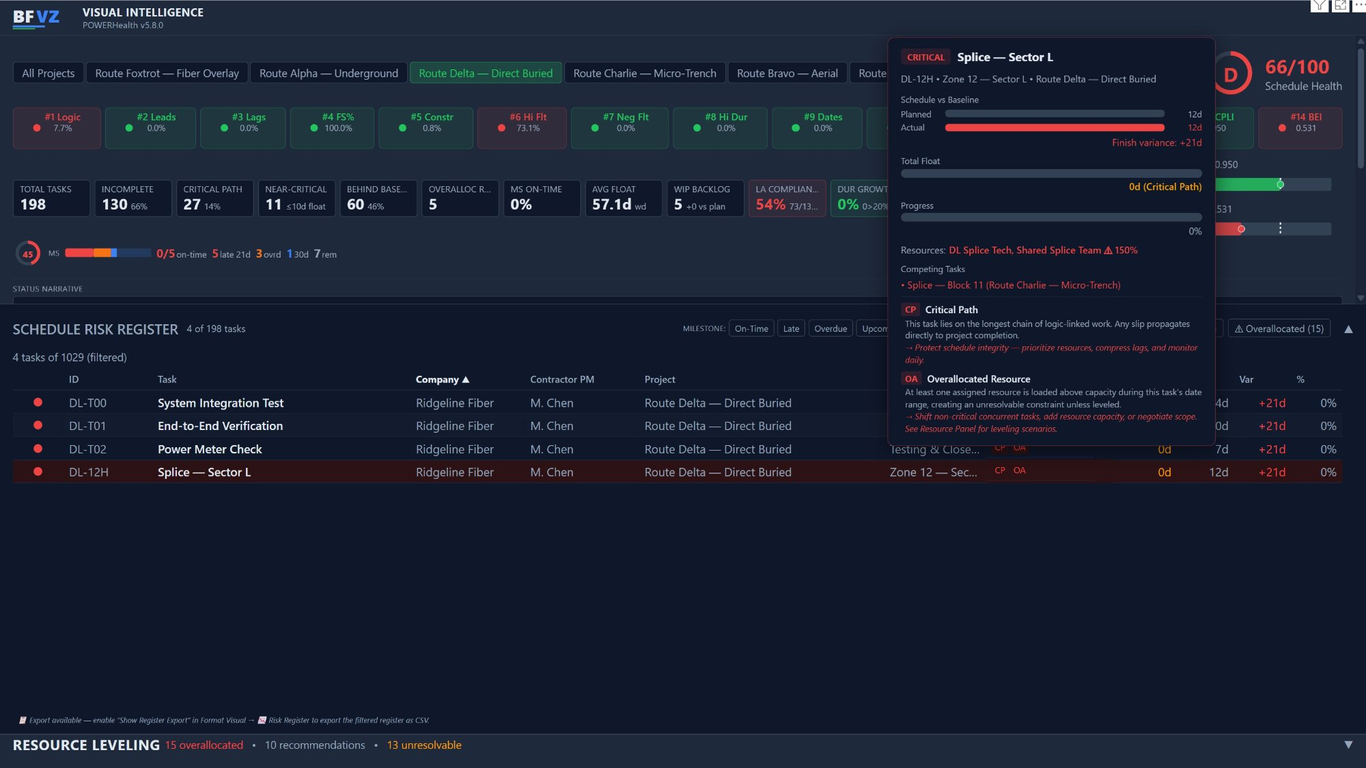
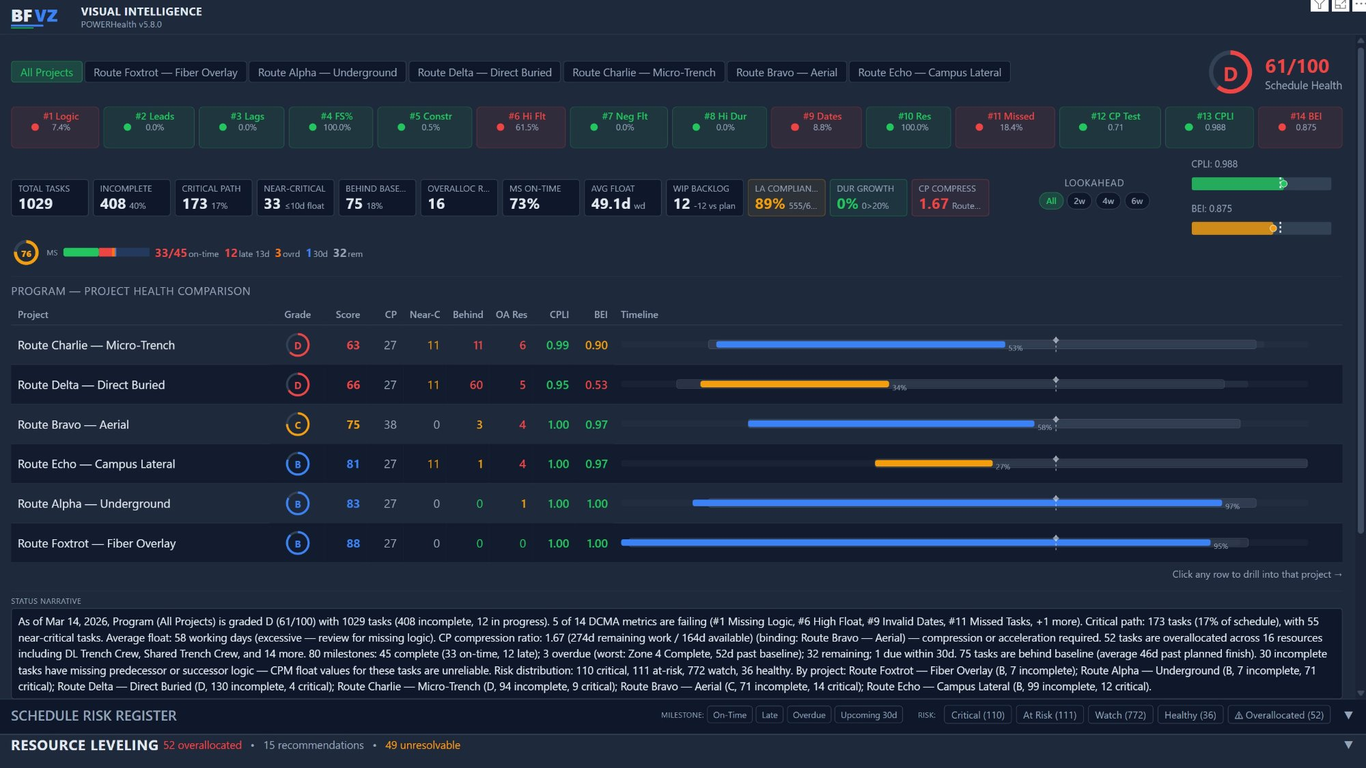
DCMA Schedule Health
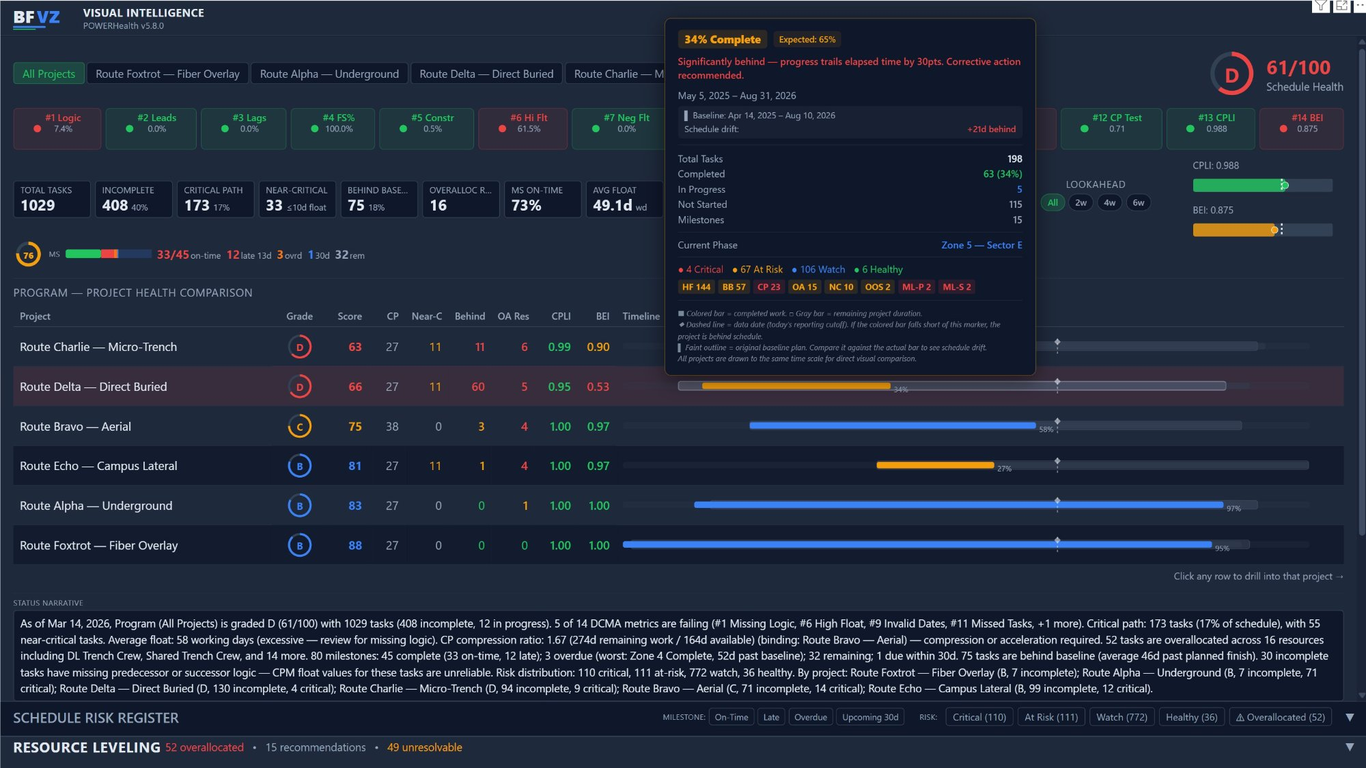
Automated DCMA 14-point analysis with configurable thresholds per metric. Weighted A-F grading system with 16 risk codes across 4 severity tiers. Program comparison table for multi-project health assessment.
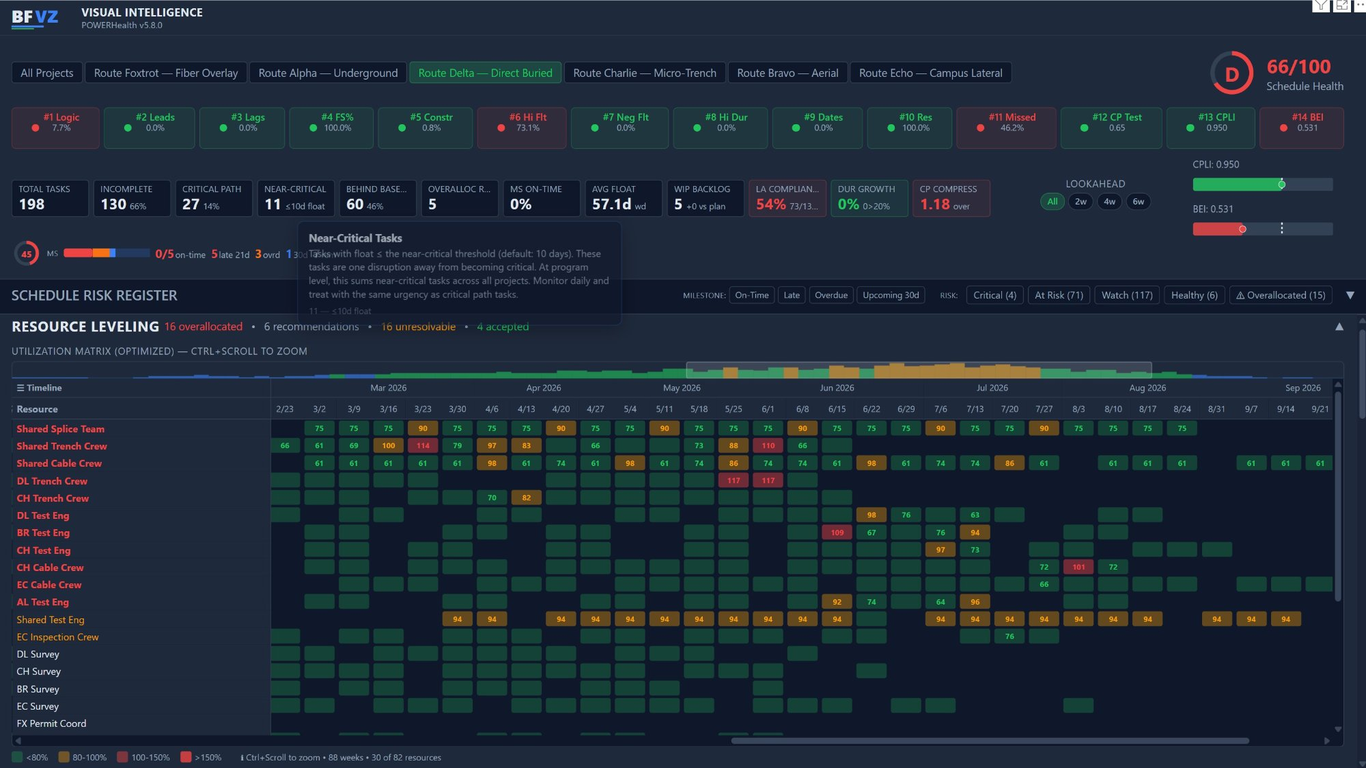
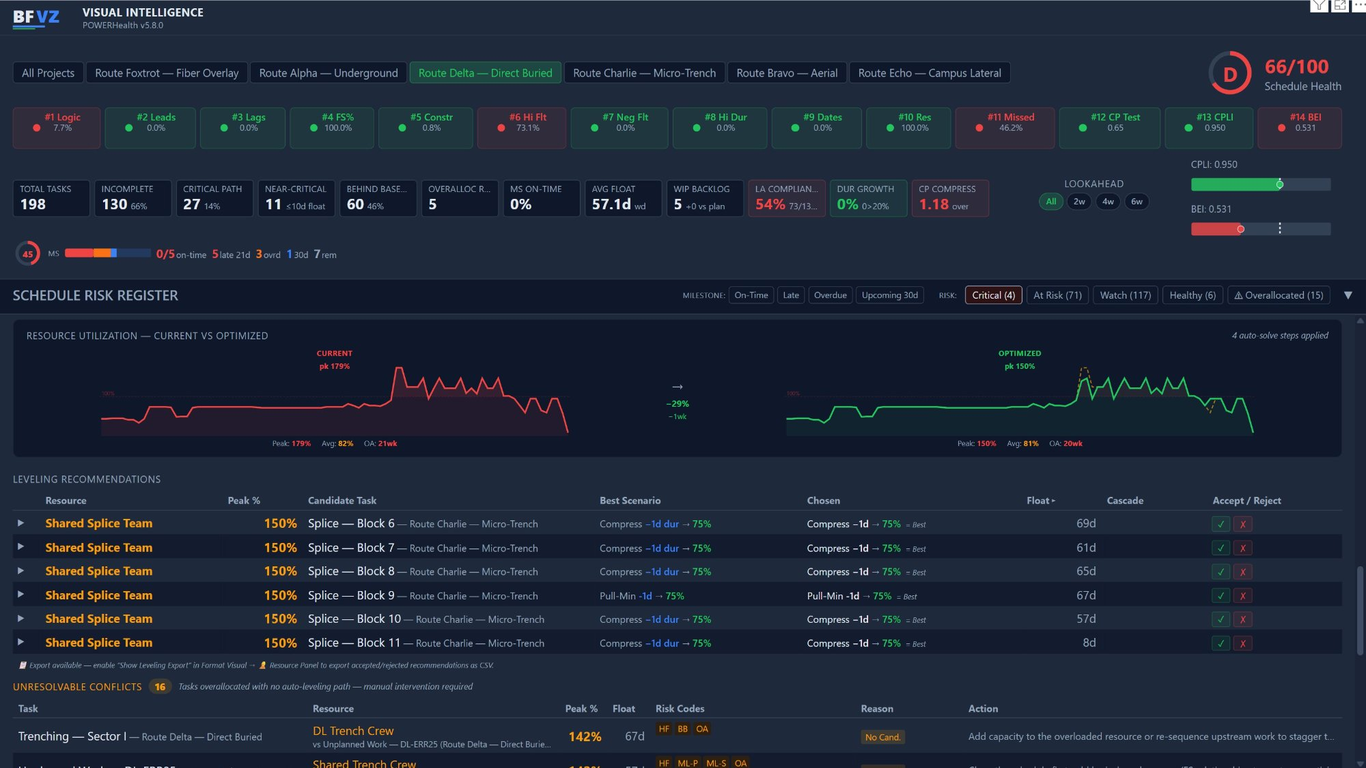
Resource Intelligence
Tri-strategy resource optimizer evaluates Push-Out, Pull-In, and Compress strategies per conflict. Heat-colored utilization matrix with Ctrl+scroll zoom. Cross-project resource conflict detection with pulsing overallocation alerts.
Cross-Visual Filtering
Both visuals share a standardized data model for seamless integration. Cross-visual highlight support dims non-matching tasks to 30% opacity. Filter by Company, PM, Controller, or Contractor through Power BI slicers.
See It In Action
Interact with a live POWERHealth portfolio dashboard loaded with sample infrastructure data. No Power BI license required.
Interactive Demo
Explore a live portfolio health dashboard with sample infrastructure data.
Interactive demo is best experienced on desktop. Try the full version on AppSource
Prefer to Watch?
See POWERHealth in action — 2-minute walkthrough of the DCMA 14-point dashboard.
Why BFVZ?
| Capability | BFVZ | xViz/Lumel | Inforiver | Generic PBI |
|---|---|---|---|---|
| CPM with phase-agnostic bridging | Yes | No | No | No |
| DCMA 14-Point Schedule Health | Yes | No | No | Manual DAX |
| Cross-project resource conflict detection | Yes | No | No | No |
| Multi-utility dependency color coding | Yes | No | No | No |
| Infrastructure risk taxonomies | Yes | No | No | No |
| Construction milestone shapes | Yes | No | No | No |
| WCAG 2.2 AA compliant | Yes | Unknown | Unknown | Varies |
| Dark theme data density | Yes | Partial | Yes | No |
Same pricing for every visual.
Priced for real PMOs.
Both BFVZPowerGantt and BFVZPowerHealth use the same Creator + Viewer licensing model. Each visual is licensed independently. Schedulers and report authors use a Creator license; executives and stakeholders use a Viewer license. Start with a full-featured 30-day trial.
- Unlimited data rows
- Dependencies & critical path
- Milestones, baselines & variance
- Conditional formatting (RAG status)
- Clean export to PDF & PowerPoint
- All 25 configuration panels
- Priority support via support@bfvztech.com
- No watermark in report view
- Unlimited data rows
- Interactive: hover, drill-through, cross-filter
- Cannot edit visual configuration
- Exports include BFVZ watermark
Team & Enterprise plans
| Plan | Seats | Monthly | Annual |
|---|---|---|---|
| Team Starter | Up to 5 creators + 25 viewers | $149/mo | $1,490/yr |
| Team Professional | Up to 10 creators + 50 viewers | $299/mo | $2,990/yr |
| Team Enterprise | Up to 25 creators + 150 viewers | $599/mo | $5,990/yr |
| Domain-Wide | Unlimited creators + unlimited viewers | Custom | $15K–$48K/yr |
How this compares
| Scenario | Competitor (annual) | BFVZ (annual) |
|---|---|---|
| Free trial | Varies (7–14 days typical) | 30 days, all features |
| Typical mid-size PMO (5 creators, 30 viewers) | $3,360/yr | $2,520/yr |
| Who needs a license? | Every user (creators + viewers) | Creators + viewers (different rates) |
| Infrastructure-specific features | Generic — no industry focus | P6 mapping, DCMA health, typed deps, PMI® standards-based |
Suite Roadmap
BFVZPowerGantt and BFVZPowerHealth are the first two live visuals in the PMO Visual Intelligence Suite. Suite subscribers get every visual we ship — all sharing a standardized data model with seamless project-to-portfolio roll-up.
- Gantt Chart Live
- KPI Scorecard Coming Q2 2026
- EVM Dashboard Coming Q2 2026
- S-Curve Analysis Coming Q3 2026
- Risk Heat Map Coming Q3 2026
- Gantt Chart Live
- KPI Scorecard Coming Q2 2026
- EVM Dashboard Coming Q2 2026
- S-Curve Analysis Coming Q3 2026
- Risk Heat Map Coming Q3 2026
- Resource Histogram Coming Q3 2026
- Dependency Matrix Coming Q3 2026
- Budget Tracker Coming Q4 2026
- Change Order Log Coming Q4 2026
- Gantt Chart Live
- KPI Scorecard Coming Q2 2026
- EVM Dashboard Coming Q2 2026
- S-Curve Analysis Coming Q3 2026
- Risk Heat Map Coming Q3 2026
- Resource Histogram Coming Q3 2026
- Dependency Matrix Coming Q3 2026
- Budget Tracker Coming Q4 2026
- Change Order Log Coming Q4 2026
- Portfolio Dashboard Coming Q4 2026
- Program Comparison Coming Q4 2026
- Compliance Tracker Coming 2027
- What-If Analyzer Coming 2027
- PMO Value Dashboard Coming 2027
- Schedule Health Live
Primavera P6 Power BI Integration & Compatibility
Power BI Ecosystem
Native Power BI Visuals API 5.11.0
P6 & MS Project
XLSX export + OData/Excel compatibility
Microsoft AppSource
Available now · Certification in progress
Data Sources
Any Power BI data model — Excel, SQL, OData, REST
Built on standards you can verify
PMI® Standards
Grounded in PMBOK® Guide — Eighth Edition
WCAG 2.2 AA
Committed to accessibility. See our accessibility statement.
Data Privacy
Visual runs entirely within Power BI — no data leaves your tenant. Zero external network calls.
AppSource
Microsoft ISV Success Partner. AppSource certification in progress.
GDPR-Ready Analytics
Self-hosted fonts, cookie consent mechanism, and no third-party data sharing. Visual processes data entirely within your tenant.
Get BFVZ visuals on Microsoft AppSource
Install BFVZPowerGantt or BFVZPowerHealth directly in Power BI and start your 30-day free trial. Questions? Reach us at support@BFVZtech.com.